

Tableau is all about creating unique and beautiful charts. Sometimes the bar chart looks naive and not so attractive.
Today we will try to create a Bar chart with different width size of each bars.
For that you can use sample superstore data or any other data source.
First step is to create a calculation = RUNNING_SUM(SUM([Sales]))-SUM([Sales])
We will now build our worksheet:
- Change the Mark Type to Bar
- Drag Sub-Category onto the Color Mark
- Drag Total Sales onto the Columns Shelf
- Right-click on this pill, go to Compute Using and select Sub-Category
- Drag Profit onto the Rows Shelf
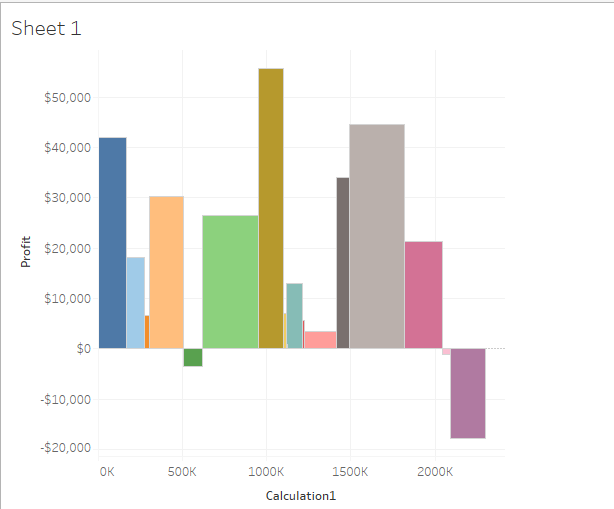
It will look like below-

Now, we will make some adjustments:
- Drag Sales onto the Size Mark
- Click on the Size Mark
- Select Fixed
- Select Alignment to Left
Now finally your dashboard is ready.
Hope it helps. Happy Learning!
