

In this article i’l discuss how to integrate python in Tableau. This can be done using Tabpy
TabPy (the Tableau Python Server) is an external service implementation which expands Tableau’s capabilities by allowing users to execute Python scripts and saved functions via Tableau’s table calculations. TabPy allows Tableau to remotely execute Python code.Users can control data and parameters being sent to TabPy by interacting with their Tableau worksheets, dashboard or stories.
Getting Started
Download and Install Python
- Go to https://www.python.org and download Python 3.7.3.
- Once downloaded, double click and install Python.
- Now we will add Python to our Path.
- Click on the Windows Start button and type sysdm.cpl and click enter; this will open your System Properties.
- Click on the Advanced tab.
- Click on Environment Variables…
- Under System variables double click on Path; if Path does not exist, click on New…
- In Edit environment variable click on New and type the following: C:\Users\YourUserName\AppData\Local\Programs\Python\Python37-32
- Keep clicking Ok to close all the configuration windows.
- Now we will test that Python has been added to your machine.
- Click on the Windows start button.
- Type CMD and click enter to open up Command Prompt.
- Now type python –version (two hyphens).
- If you see Python 3.7.3, or whichever version you have installed, Python is working.
Download and Install TabPy
- Go to the following website https://github.com/tableau/TabPy/releases.
- Click on Source code (zip) to download the TabPy code.
- Once the file is downloaded, unzip the contents.
- Go to this directory and double click on startup.cmd.
Now we will try to connect Tableau to the TabPy Server.
- Open Tableau Desktop.
- Go to Help in the application menu.
- Go to Settings and Performance and select Manage External Service Connection.
- In the External Service Connection dialogue window:
- In Select an External Service and select TabPy/External API.
- In Server type localhost.
- in Port type 9004, you can see the port that TabPy started on in the image above.
- Click Test Connection
We are going to start by opening the Sample Superstore Data Source that is provided with Tableau Desktop. Using this Data Source, we are going to create a Calculated Field to perform Pearson’s Correlation Coefficient (r).
Let us create a Calculated Field called Pearson Correlation Coefficient:
SCRIPT_REAL(“import numpy as np
return np.corrcoef(_arg1,_arg2)[0,1]”,
SUM([Sales]),SUM([Profit]))
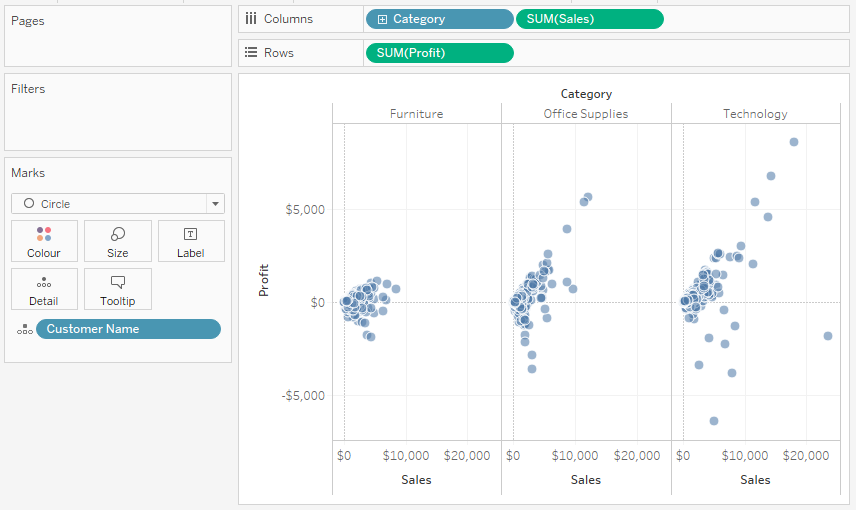
- Change the Mark Type to Circle.
- Drag Category onto Columns.
- Drag Sales onto Columns.
- Drag Profit onto Rows.
- Drag Customer Name onto the Detail Mark.
You should now have the following:
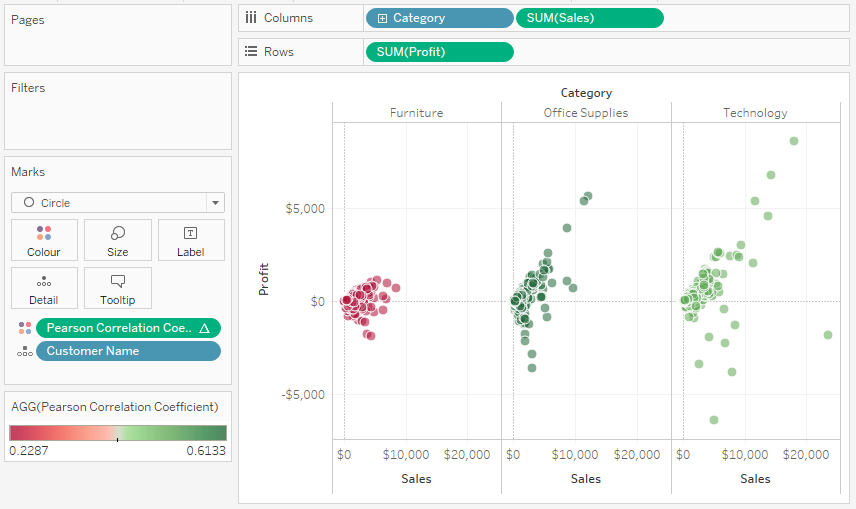
- Drag Pearson Correlation Coefficient onto the Colour Mark.
- You will see an invalid JSON error, but do not worry about that. Please close the dialogue.
- Right-click on this object, go to Compute Using and select Customer Name.
- Click on the Color Mark.
- Click on Edit Colour and select the Red-Green Diverging.
You should now end up with the following:
That’s it. We have successfully created a chart using Python library. You can do almost any python code using tabpy in Tableau.
Hope it helps. Happy Learning!
